

A comparison of carrier roaming rates vs. eSIM pricing across 30 destinations and 3 home markets — esimintel.com, 2026
Key Findings
This study compared 9 major carriers across the US, UK, and Canada against the cheapest qualifying travel eSIM, for a standard 7-day trip to 30 popular destinations.
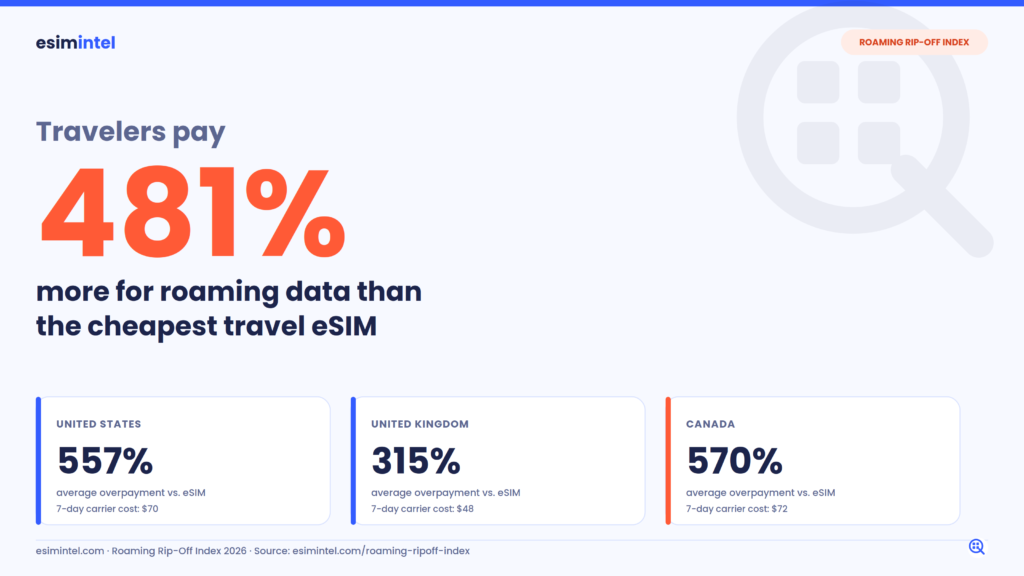
- Travelers pay an average of 481% more for carrier roaming than for an eSIM covering the same trip.
- Canadian travelers face the steepest markups of any market: 570% on average, and the single worst deal in the entire study.
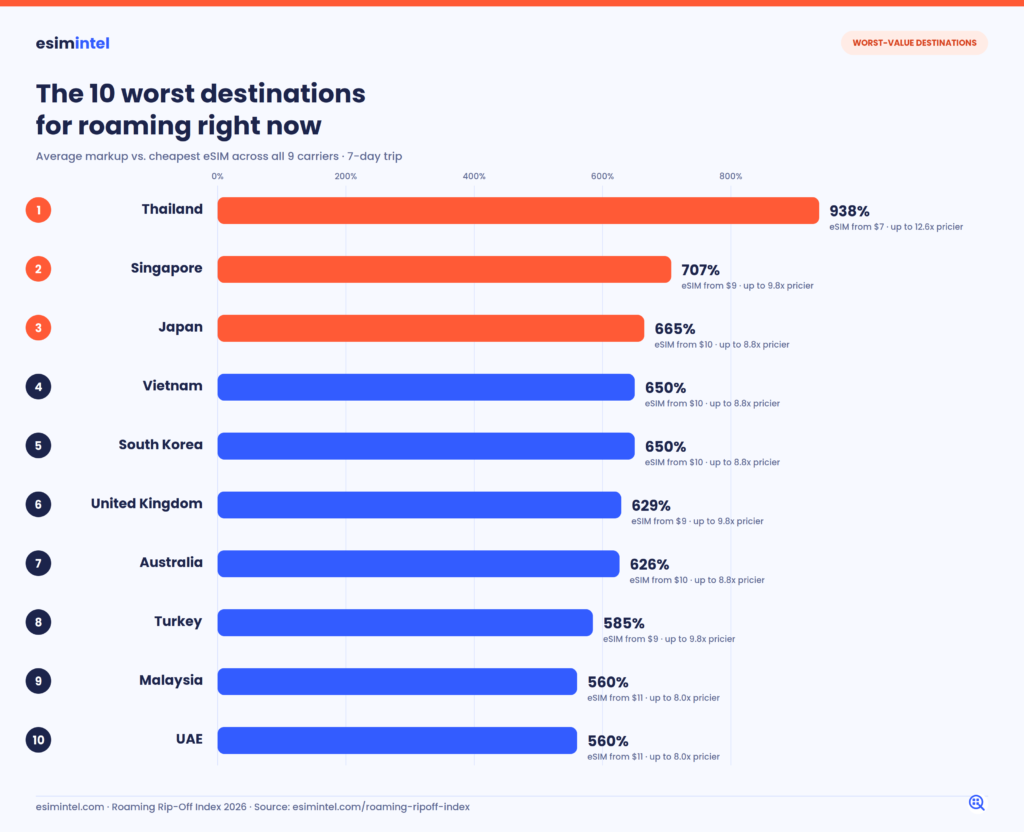
- Thailand is the world’s worst destination for roaming value, 938% average markup across all nine carriers.
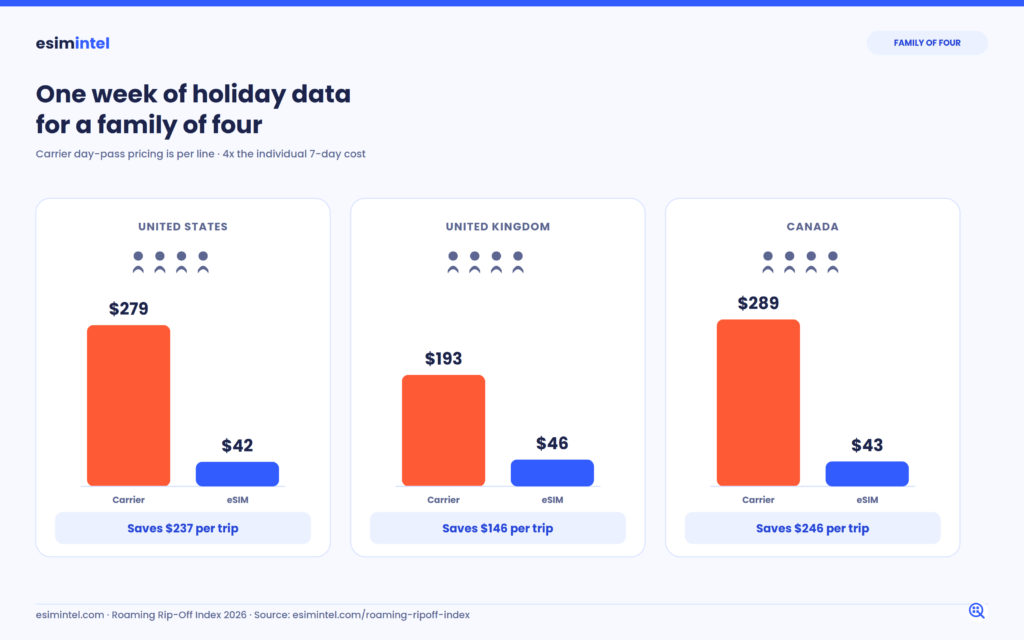
- A family of four pays $279 (US), $289 (Canada), or $193 (UK) for a week of carrier data, versus under $50 on eSIMs.
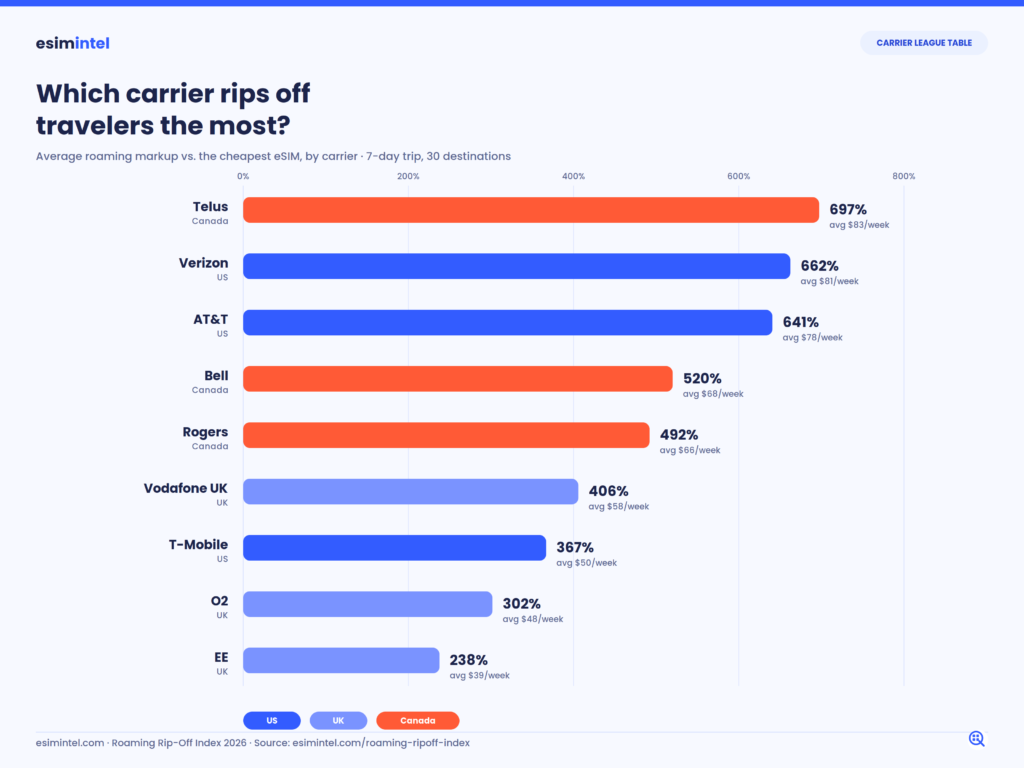
- Telus is the single most expensive carrier in the study (697% average markup); EE is the least expensive of the nine (238%).
- Not every carrier overcharges: O2 includes EU roaming free on every plan, and AT&T includes Mexico and Canada roaming at no extra cost.
Why we built this
Every summer, millions of travelers land abroad, turn on their phone, and quietly agree to whatever their carrier charges for a few gigabytes of data. Roaming pricing is opaque by design: rates are buried in help-center pages, split across zones and tariff generations, and rarely compared side by side. Meanwhile, the eSIM market has made buying a local data plan before you even board the flight trivially easy and, in almost every case, dramatically cheaper.
eSIM Intel compared official roaming rates from 9 major carriers across the United States, United Kingdom, and Canada against the cheapest travel eSIM available for 30 of the world’s most visited destinations. This page presents the full dataset, the methodology behind it, and what it means for anyone packing a bag this year.
The headline numbers
Across all 261 carrier-destination pairs studied, the average traveler overpays by 481% when they roam on their home carrier instead of buying a travel eSIM. That means a week of data that costs roughly $12 on a whitelisted eSIM provider costs an average of $63 through a traditional carrier day pass or roaming plan.
The gap is not evenly spread. Canadian travelers face the steepest average markup of the three markets (570%), narrowly ahead of the US (557%). UK travelers see a comparatively milder average of 315%, dragged down by O2’s decision to include EU roaming at no extra cost on every plan — a genuine outlier in this dataset, and one of the few carrier decisions in the study that actually favors the traveler.
Market Summary
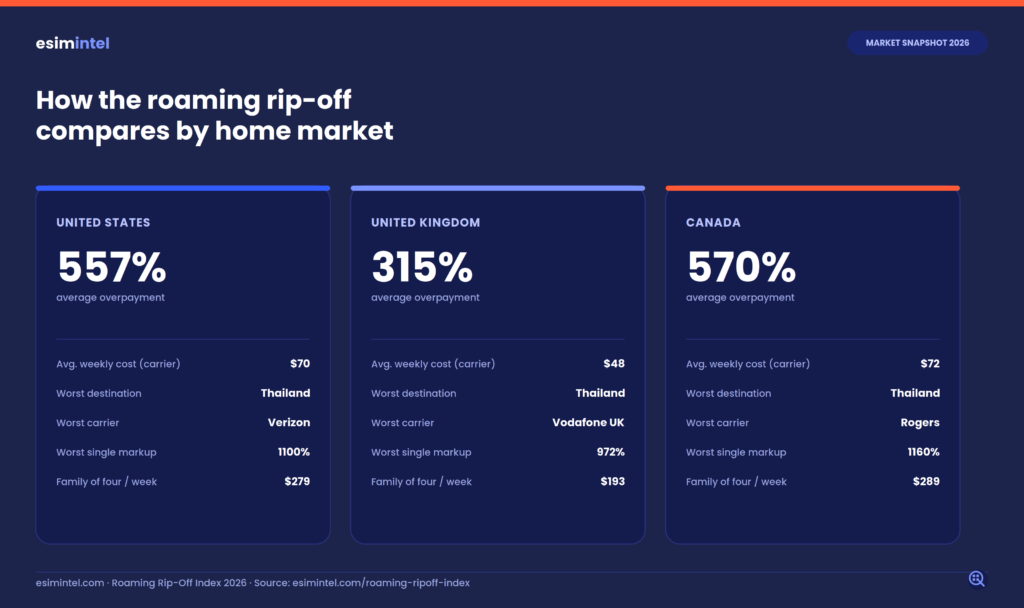
Headline numbers by home market. “Family of four” reflects per-line day-pass pricing x4.
| Home Market ↕ | Avg. Markup ↕ | Avg. 7-Day Cost ↕ | Family of Four ↕ | Worst Destination ↕ | Worst Carrier ↕ | Worst Markup ↕ |
|---|---|---|---|---|---|---|
| United States | 557% | $69.77 | $279.08 | Thailand | Verizon | 1100% |
| United Kingdom | 315% | $48.22 | $192.90 | Thailand | Vodafone UK | 972% |
| Canada | 570% | $72.20 | $288.82 | Thailand | Rogers | 1160% |
Source: eSIM Intel Roaming Rip-Off Index, 2026.
Which carrier rips off travelers the most?
At the other end, EE posts the lowest average markup of the nine carriers studied (238%), and T-Mobile’s flat 10-day international pass ($50) undercuts the day-pass pricing used by Verizon and AT&T. None of the nine carriers in this study is cheaper than an eSIM on average — the best any of them manages is still more than double the eSIM price.
Some carriers are dramatically worse value than others. Telus tops the list with a 697% average markup and the single worst deal recorded anywhere in the study: $88.20 for a week of Thailand roaming, versus a $7 eSIM covering the same trip, a 12.6x multiple. Verizon and AT&T are close behind, both averaging well over 600%.
Carrier League Table
All 9 carriers ranked by average roaming markup vs. the cheapest qualifying eSIM. 7-day trip, 30 destinations. Click any header to sort.
| Carrier ↕ | Market ↕ | Avg. Markup ↕ | Avg. 7-Day Cost ↕ | Worst Destination ↕ | Worst Markup ↕ |
|---|---|---|---|---|---|
| 1Telus | Canada | 697% | $82.94 | Thailand | 1160% |
| 2Verizon | US | 662% | $81.10 | Thailand | 1100% |
| 3AT&T | US | 641% | $78.21 | Thailand | 1100% |
| 4Bell | Canada | 520% | $67.76 | Thailand | 1020% |
| 5Rogers | Canada | 492% | $65.92 | Thailand | 1160% |
| 6Vodafone UK | UK | 406% | $58.06 | Thailand | 972% |
| 7T-Mobile | US | 367% | $50.00 | Thailand | 614% |
| 8O2 | UK | 302% | $47.50 | Thailand | 838% |
| 9EE | UK | 238% | $39.11 | Japan | 650% |
Source: eSIM Intel Roaming Rip-Off Index, 2026. Full methodology below.
The world’s worst destinations for roaming
Popularity and roaming value are almost inversely related. Thailand, Singapore, Japan, Vietnam, and South Korea, five of the most visited countries in Southeast and East Asia, occupy five of the six worst spots in the destination rankings. Thailand alone averages a 938% markup across all nine carriers, and produces the worst single data point in the entire study.
Popular short-haul European trips fare only slightly better. Spain and France average a 513% markup, and Canadian travelers to either destination on Telus pay over 1,000% more than the eSIM equivalent.
Destinations Ranked by Average Roaming Markup
All 30 destinations, worst value first. “Worst carrier” shows the single most expensive carrier for that destination. Click any header to sort.
| Destination ↕ | Avg. Markup ↕ | Max Multiple ↕ | Cheapest eSIM ↕ | Worst Carrier ↕ | Worst 7-Day Cost ↕ |
|---|---|---|---|---|---|
| 1Thailand | 938% | 12.6x | $7.00 | Canada Rogers | $88.20 |
| 2Singapore | 707% | 9.8x | $9.00 | Canada Rogers | $88.20 |
| 3Japan | 665% | 8.8x | $10.00 | Canada Rogers | $88.20 |
| 4Vietnam | 650% | 8.8x | $10.00 | Canada Rogers | $88.20 |
| 5South Korea | 650% | 8.8x | $10.00 | Canada Rogers | $88.20 |
| 6United Kingdom | 629% | 9.8x | $9.00 | Canada Telus | $88.20 |
| 7Australia | 626% | 8.8x | $10.00 | Canada Rogers | $88.20 |
| 8Turkey | 585% | 9.8x | $9.00 | Canada Telus | $88.20 |
| 9Malaysia | 560% | 8.0x | $11.00 | Canada Rogers | $88.20 |
| 10UAE | 560% | 8.0x | $11.00 | Canada Rogers | $88.20 |
| 11Spain | 513% | 11.0x | $8.00 | Canada Telus | $88.20 |
| 12France | 513% | 11.0x | $8.00 | Canada Telus | $88.20 |
| 13Indonesia | 505% | 7.3x | $12.00 | Canada Rogers | $88.20 |
| 14India | 459% | 6.8x | $13.00 | Canada Rogers | $88.20 |
| 15New Zealand | 459% | 6.8x | $13.00 | Canada Rogers | $88.20 |
| 16Portugal | 445% | 9.8x | $9.00 | Canada Telus | $88.20 |
| 17Netherlands | 445% | 9.8x | $9.00 | Canada Telus | $88.20 |
| 18Switzerland | 445% | 9.8x | $9.00 | Canada Telus | $88.20 |
| 19Croatia | 416% | 9.3x | $9.50 | Canada Telus | $88.20 |
| 20Morocco | 410% | 5.9x | $15.00 | Canada Rogers | $88.20 |
| 21Egypt | 394% | 5.9x | $15.00 | Canada Rogers | $88.20 |
| 22Italy | 391% | 8.8x | $10.00 | Canada Telus | $88.20 |
| 23Greece | 391% | 8.8x | $10.00 | Canada Telus | $88.20 |
| 24Germany | 391% | 8.8x | $10.00 | Canada Telus | $88.20 |
| 25Argentina | 346% | 5.5x | $16.00 | Canada Rogers | $88.20 |
| 26Mexico | 346% | 7.3x | $12.00 | Canada Telus | $88.20 |
| 27United States | 310% | 6.0x | $12.50 | UK Vodafone UK | $75.04 |
| 28Dominican Republic | 304% | 4.9x | $18.00 | Canada Rogers | $88.20 |
| 29Canada | 203% | 5.0x | $15.00 | UK Vodafone UK | $75.04 |
| 30Brazil | 59% | 2.0x | $45.00 | Canada Rogers | $88.20 |
Source: eSIM Intel Roaming Rip-Off Index, 2026.
The family tax: why roaming costs multiply per traveler
Carrier day passes and roaming fees are charged per line, not per household, so the cost of a family trip scales directly with the number of phones in the group. For a family of four, the average carrier bill for a single week climbs to $279 in the US, $289 in Canada, and $193 in the UK — compared with roughly $49 for four eSIMs. Few travelers running the numbers for a single line ever extend the same math to their whole family, which is exactly where the carrier markup does the most damage.
The exceptions: where roaming isn’t a rip-off
This study is built to be fair to carriers as well as critical of them, and the data includes several honest exceptions worth highlighting on their own:
- O2 (UK) includes EU roaming at no extra charge, up to 25GB, on every current pay monthly plan. It is the only carrier in the study with a 0% markup across an entire region.
- AT&T (US) includes Mexico and Canada roaming at no additional cost on most current plans, matching or beating eSIM pricing for those two destinations.
- Brazil is the only destination in the study where the average markup falls under 100% (59%), though this is because local eSIM pricing there is unusually high ($45), not because carrier rates are especially fair.
These exceptions matter for the integrity of the study: they show the methodology surfaces good deals as readily as bad ones, and they give a useful counter-example to the industry’s overall pricing pattern.
The full dataset
The table below is the complete underlying dataset behind every figure on this page: average weekly roaming cost by destination and home market, against the cheapest qualifying eSIM. Here’s how to read it.
What each column means
- Destination: the country being traveled to. All 30 destinations studied are listed, sorted by average markup, worst first.
- US Carriers (avg) / UK Carriers (avg) / Canada Carriers (avg): the average 7-day roaming cost across that market’s carriers for this destination (Verizon, AT&T, and T-Mobile for the US; EE, Vodafone UK, and O2 for the UK; Rogers, Bell, and Telus for Canada). Averaging the three carriers, rather than showing only the cheapest or the priciest, gives a representative figure for “what a traveler on that market’s typical carrier would pay,” rather than a best-case or worst-case outlier.
- Cheapest eSIM: the price of the cheapest whitelisted eSIM plan for that destination meeting the study’s floor of at least 5GB and at least 7 days of validity. This is the same number for all three markets, since eSIM pricing doesn’t vary by traveler nationality.
- Avg. Markup: how much more the average carrier price is versus the eSIM price, expressed as a percentage, averaged across whichever of the three home markets have data for that destination. This is the headline comparison figure used throughout the study.
How the numbers are calculated
Every carrier figure starts from the single cheapest option that fully covers a 7-day trip for a standard postpaid or pay-monthly customer, which might be a daily roaming fee charged seven times, a flat multi-day pass, or a data bundle, whichever works out cheapest for that specific carrier and destination. That per-carrier figure is then averaged with the other carriers in the same home market to produce the market column shown in the table.
The markup percentage is calculated as (average carrier cost − eSIM cost) ÷ eSIM cost, then converted to a percentage. A destination showing a 500% markup means the average carrier price is six times the eSIM price; a destination showing 0% means carrier and eSIM pricing are roughly equal. A small number of rows, such as O2’s European coverage or AT&T’s Mexico and Canada roaming, show negative or zero markups because those specific carriers charge nothing extra for that destination; these are genuine data points, not errors, and are called out directly in the “exceptions” section above.
The exact rules behind these calculations, including which tariffs qualify as “standard,” how currency conversion was handled, and which eSIM providers were eligible, are set out in full in the methodology below.
Full Dataset: Average Weekly Roaming Cost by Destination and Home Market
Average carrier cost per market (all carriers in that market averaged) vs. cheapest qualifying eSIM. 7-day trip. This is the complete underlying dataset. Click any header to sort.
| Destination ↕ | US Carriers (avg) ↕ | UK Carriers (avg) ↕ | Canada Carriers (avg) ↕ | Cheapest eSIM ↕ | Avg. Markup ↕ |
|---|---|---|---|---|---|
| Thailand | $72.67 | $60.30 | $84.93 | $7.00 | 938% |
| Singapore | $72.67 | $60.30 | $84.93 | $9.00 | 707% |
| Japan | $72.67 | $71.91 | $84.93 | $10.00 | 665% |
| Vietnam | $72.67 | $67.45 | $84.93 | $10.00 | 650% |
| South Korea | $72.67 | $67.45 | $84.93 | $10.00 | 650% |
| United Kingdom | $72.67 | — | $58.57 | $9.00 | 629% |
| Australia | $72.67 | $60.30 | $84.93 | $10.00 | 626% |
| Turkey | $72.67 | $43.88 | $68.37 | $9.00 | 585% |
| Malaysia | $72.67 | $60.30 | $84.93 | $11.00 | 560% |
| UAE | $72.67 | $60.30 | $84.93 | $11.00 | 560% |
| Spain | $72.67 | $15.97 | $58.57 | $8.00 | 513% |
| France | $72.67 | $15.97 | $58.57 | $8.00 | 513% |
| Indonesia | $72.67 | $60.30 | $84.93 | $12.00 | 505% |
| India | $72.67 | $60.30 | $84.93 | $13.00 | 459% |
| New Zealand | $72.67 | $60.30 | $84.93 | $13.00 | 459% |
| Portugal | $72.67 | $15.97 | $58.57 | $9.00 | 445% |
| Netherlands | $72.67 | $15.97 | $58.57 | $9.00 | 445% |
| Switzerland | $72.67 | $15.97 | $58.57 | $9.00 | 445% |
| Croatia | $72.67 | $15.97 | $58.57 | $9.50 | 416% |
| Morocco | $72.67 | $71.91 | $84.93 | $15.00 | 410% |
| Egypt | $72.67 | $64.77 | $84.93 | $15.00 | 394% |
| Italy | $72.67 | $15.97 | $58.57 | $10.00 | 391% |
| Greece | $72.67 | $15.97 | $58.57 | $10.00 | 391% |
| Germany | $72.67 | $15.97 | $58.57 | $10.00 | 391% |
| Argentina | $72.67 | $71.91 | $69.53 | $16.00 | 346% |
| Mexico | $30.67 | $60.30 | $69.53 | $12.00 | 346% |
| United States | — | $60.30 | $42.23 | $12.50 | 310% |
| Dominican Republic | $72.67 | $60.30 | $84.93 | $18.00 | 304% |
| Canada | $30.67 | $60.30 | — | $15.00 | 203% |
| Brazil | $72.67 | $71.91 | $69.53 | $45.00 | 59% |
Source: eSIM Intel Roaming Rip-Off Index, 2026. Methodology: cheapest option covering a 7-day trip, standard postpaid/pay monthly tariffs, collected July 2026. Full methodology at esimintel.com/roaming-ripoff-index.
Methodology
All carrier rates reflect the cheapest published option covering a full 7-day trip, for a standard postpaid or pay monthly customer on a current, non-legacy tariff. Where both a daily fee and a multi-day pass or bundle exist, the cheaper of the two is used. Prepaid/PAYG tariffs and legacy grandfathered rates are excluded throughout. In the UK specifically, pay monthly represents approximately 80% of mobile subscriptions, making it the representative choice rather than an edge case.
eSIM rates reflect the cheapest plan of at least 5GB with at least 7 days validity, from a whitelist of established providers (Airalo, Saily, Ubigi, Nomad, Yesim, Alosim, Maya Mobile, Redteago), collected on the same date as the corresponding carrier rate. The 5GB floor, rather than a fixed target, means the cheapest qualifying plan was used even where it carried meaningfully more data than the floor — for example, France’s cheapest qualifying eSIM was a 10GB Ubigi plan priced below the available 5GB alternatives.
Home markets and carriers
- United States: Verizon, AT&T, T-Mobile
- United Kingdom: EE, Vodafone UK, O2
- Canada: Rogers, Bell, Telus
Scope
30 destinations were selected for a mix of global travel popularity and regional spread across Europe, Asia, the Americas, the Middle East, and Oceania. Rows where the destination equals the traveler’s home country are excluded.
Data collection
Carrier rates were collected directly from official carrier pricing and roaming pages, archived via the Wayback Machine on the date of collection. Currency conversions use exchange rates recorded on the same date. The full data collection workbook, including source URLs and archive links for every row, is available on request.
Limitations
Carrier day passes and multi-day passes typically include more data than the study’s 5GB eSIM comparison point, so this study understates the data volume a carrier pass provides relative to its price, even as it demonstrates the price gap on a like-for-like basis. Rates are a snapshot in time and are subject to change; carriers are known to revise roaming pricing with limited notice.
About eSIM Intel
eSIM Intel is an independent eSIM comparison platform aggregating travel data plans across 200+ countries from providers including Airalo, Saily, Ubigi, Nomad, and Yesim. eSIM Intel does not sell eSIMs directly and does not accept payment for provider placement in its comparisons.